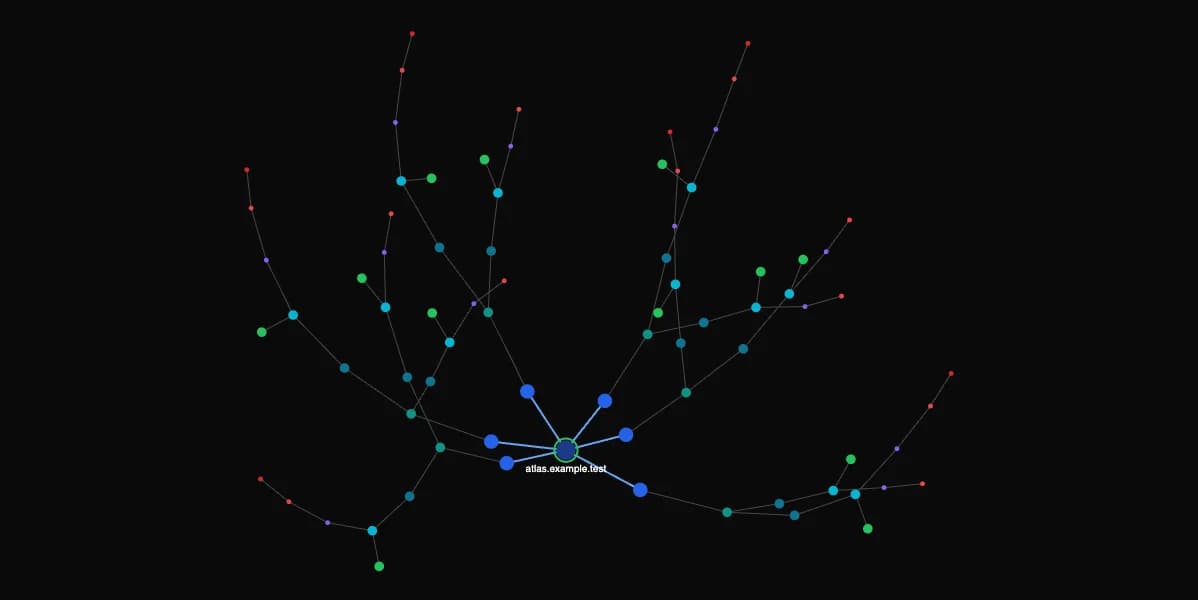
The RedAmon 3D graph experience, populated entirely with synthetic examples. Follow an asset to its services, components and observations. Nothing here represents a customer assessment.
Larger nodes sit higher in the asset tree, and arrows lead outward from the domain. The ring marks the selected node; its links are highlighted.
Synthetic RedAmon graph · the 3D graph renderer uses invented nodes and relationships. No customer data, live scan or validated result. atlas.example.test · Domain
This node is invented and has 6 relationships. Its category shows how RedAmon represents related assets and observations.
has subdomain
has subdomain
has subdomain
has subdomain
has subdomain
has subdomain
Renderer adapted from RedAmon (MIT). Licence · Download synthetic dataset. Drag to orbit; right-drag or use two fingers to pan. Use the view controls to zoom. No automatic rotation.